Cost anomalies
Overview
DoiT Cloud cost anomaly detection offers end-to-end monitoring of spikes in your Google Cloud, Amazon Web Services, and Microsoft Azure costs across your projects and services.
The detection service leverages time series modeling to monitor billing data and analyze the trend of spending in your cloud environment. It identifies billing patterns across DoiT customers, forecasts your cloud spending, and continuously refined to provide even more accurate results.
Billing records that don't align with your anticipated spending behavior are identified as potential anomalies. You can also get insights into which resources are causing the anomalies and take corrective actions if necessary.
Before you begin
The data analysis begins as soon as you sign up. However, for anomaly detection to work properly, we need at least 14 days of reference data in a specific project.
In case anomaly detection is critical to your operation, we recommend that you wait this 14-day period out before making significant changes to your cloud spending.
- Attributions Manager, Anomalies Viewer, Cloud Analytics
Access anomalies
To access detected cost anomalies, select Governance from the top navigation menu, and then select Cost anomalies.
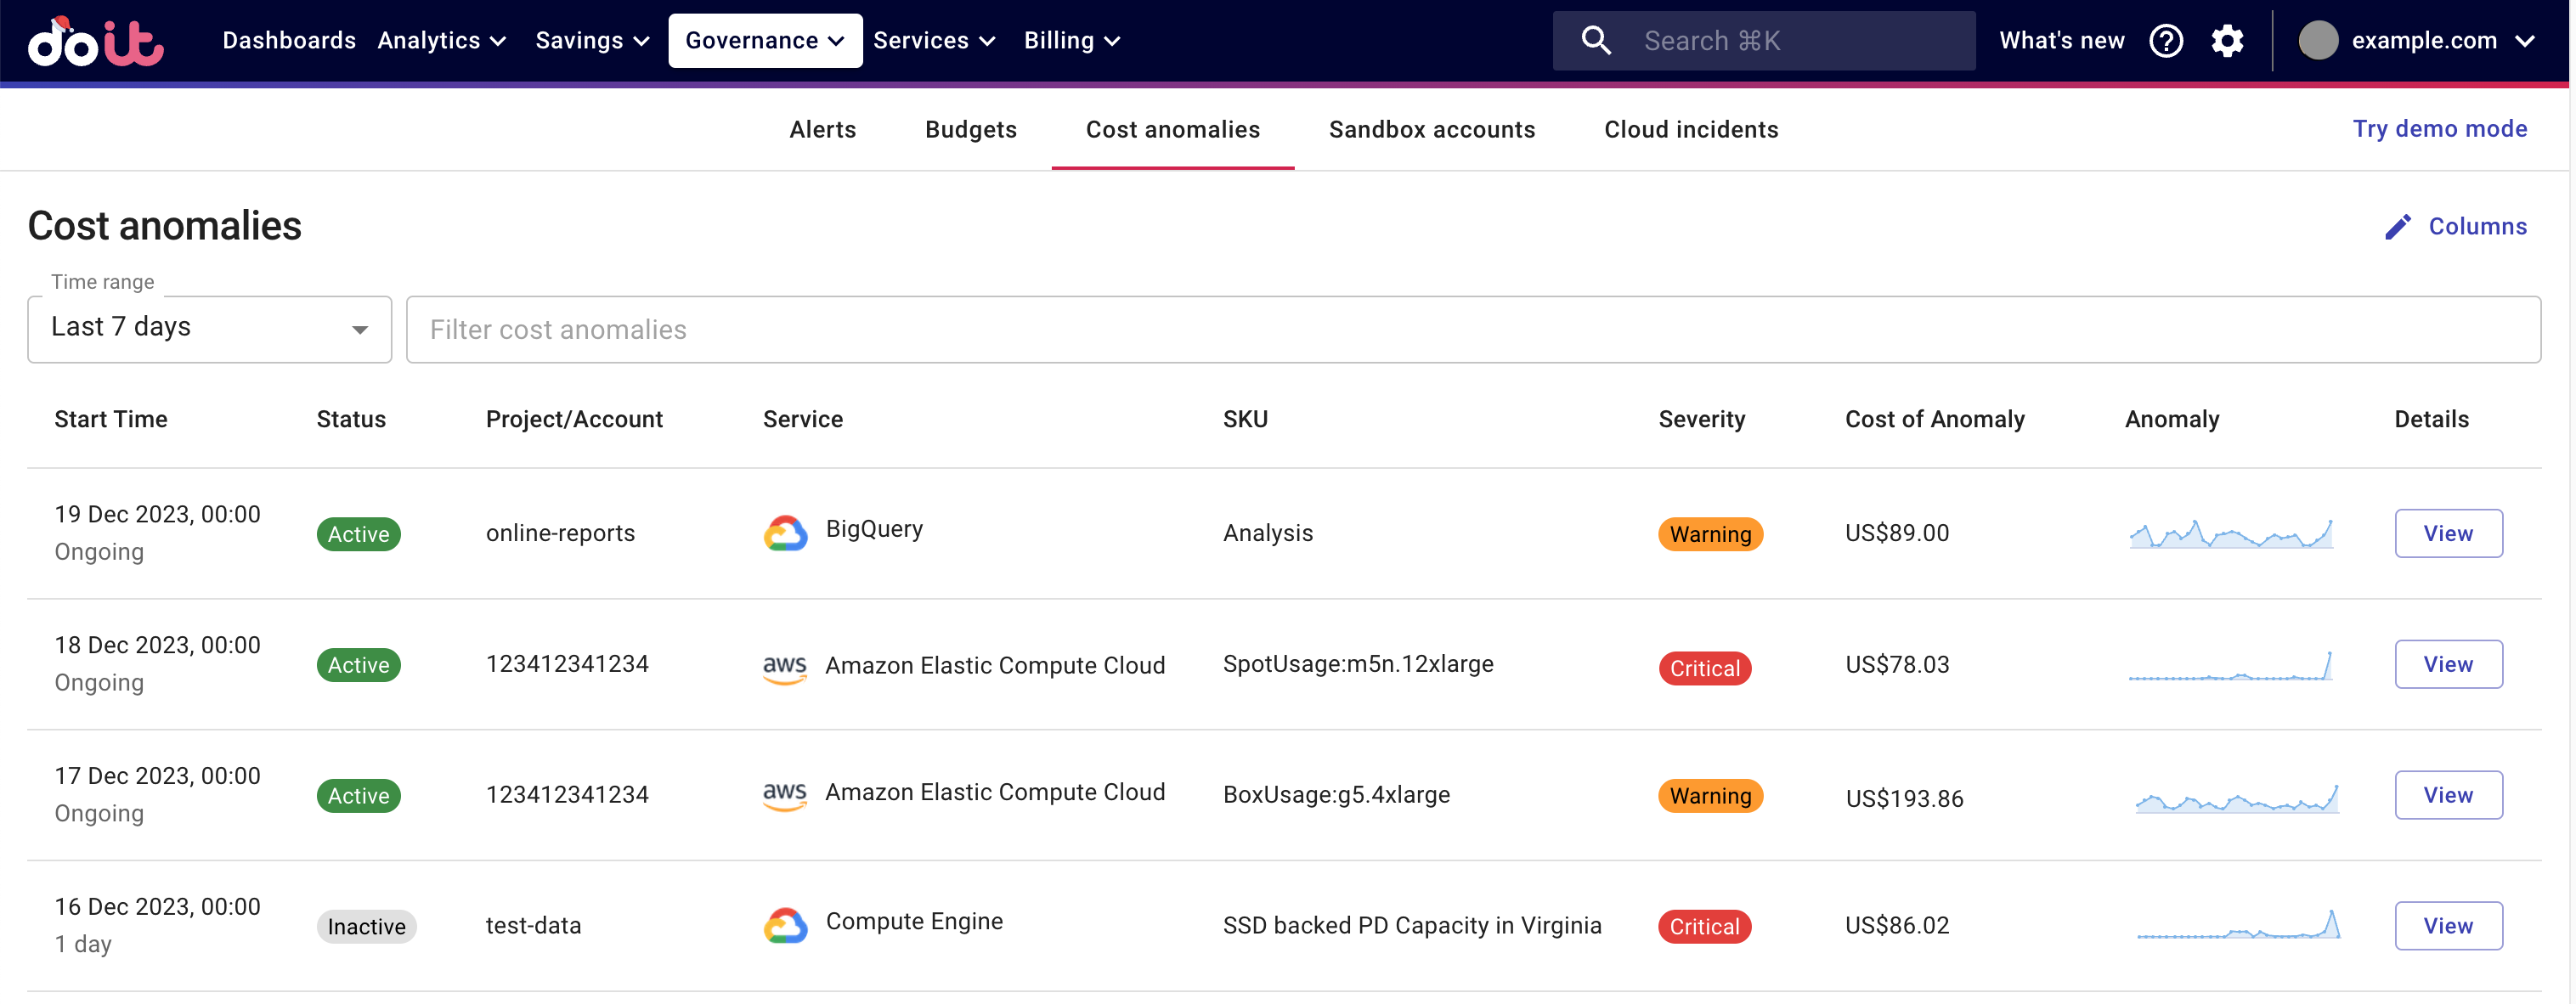
The DoiT Platform stores all the historical cost anomalies. You can use the Time range or anomaly properties to filter the results.
Anomaly properties
Each anomaly entry on the Cost anomalies page consists of the following information:
Start Time: The start time of the hourly usage window on which the aggregated cost exceeds the predefined threshold and is considered a potential anomaly. The time value comes from the billing data by the cloud providers: for AWS it is the
lineItem/UsageStartDate(UTC); for Google Cloud it is theusage_start_time(PT); for Azure it is the propertyusageStart(UTC). See also Time zone.Status: Shows whether an anomaly is
ActiveorInactive. See Dynamic updates. This field is valid for anomalies detected after December 11, 2023.Project/Account: See Hierarchy groups: Project/Account ID.
Service: See Resource metadata: Service.
SKU: The Stock Keeping Unit of a service. See Resource metadata: SKU.
Severity: The severity level of the anomaly. There are three severity levels:
Information,Warning, andCritical. They're defined by DoiT in accordance with the extent to which the actual cost deviates from the established pattern.Cost of anomaly: The difference between the actual cost and the maximum cost in the normal range.
Anomaly: A thumbnail image of the anomaly chart.
Details: Select the View button in this column to view the details of a specific anomaly.
How it works
The anomaly detection system uses a time-series model to evaluate the cost and usage data per SKU.
Evaluation scope
Data samples evaluated by the system are partitioned as follows:
- per billing account
- per project/account
- per service
- per SKU
- per attribution (if applicable)
The anomaly detection system evaluates anomalies per SKU, per service, and per project/account across regions. It doesn't evaluate multiple services in a project/account as a whole or multiple projects/accounts per service.
Criteria
To be classified as an anomaly, the spend of a SKU must meet all the following criteria:
The daily spend of the SKU is at least US$50.
The daily spend exceeds monthly seasonality.
The daily spend exceeds the upper bound of the system's normal range (or acceptable range).
The anomaly detection system uses a model fitted on data from the preceding period to forecast expected spend. The normal range is determined by a DoiT-specific confidence interval, which represents a range within which a certain percentage of possible values should fall. For example, a 90% confidence interval indicates the range for 90% of possible values.
The normal range is depicted as a shaded area on cost anomaly charts.
Detection latency
In most cases, an anomaly is reported within 12 hours once the aggregated cost exceeds the predefined threshold.
The anomaly detection engine checks usage and cost data hourly. The latency mainly relates to the varying intervals at which cloud providers report usage and cost data.
See also AWS cost data latency in DoiT Console and Google Cloud's frequency of data loads.
Dynamic updates
An ongoing anomaly is regarded as an Active anomaly. The detection system keeps monitoring active anomalies, constantly updating the system with latest available cost data.
An anomaly becomes Inactive when either of the following conditions is met:
Cost falls back into the new normal range.
The anomaly has reached the maximum active period of 7 days.
You can find more information about when an anomaly becomes Active and Inactive on cost anomaly charts.
FAQ
Why was a spike in my costs not reported as an anomaly?
The anomaly detection system evaluates costs per SKU per service, it doesn't evaluate the combined costs of multiple SKUs or services.
If a spike in your cloud costs was not detected as an anomaly, it's important to first assess whether the spike was caused by multiple SKUs or services.
In addition, the spend of an SKU must meet a specific set of criteria to qualify as an anomaly.
How does anomaly detection differ from alerts?
Anomaly detection differs from cost alerts in the following aspects:
Scope: Anomaly detection always monitors individual SKUs, while the scope of cost alerts is defined by attribution (though it's possible to break down the evaluation by service and SKU)
Condition: The condition to trigger an alert is a single threshold, for example, a 5% increase of weekly cost. In contrast, to be classified as an anomaly, the cost must meet multiple criteria.
Objectivity: An alert reacts to an objective threshold, while anomaly detection also considers the anticipated spending behavior established by a fitted time series model.
In general, alerts are more "sensitive" or easily triggered than anomaly detection.
How does a cost anomaly alert differ from its report?
Data values
The chart included in a cost anomaly alert provides a snapshot of the billing data as at the time of the detection.
The corresponding report (accessed via the Open in Reports button) contains the most up-to-date data and may therefore differ slightly at the latest time steps.
Data availability
The anomaly detection system uses the freshest billing data available in order to expedite alerts.
The report uses more detailed tables that require additional processing, with an accompanied delay in data availability. This may result in billing data which triggered an alert being temporarily unavailable in the report at the time that the alert is sent.
Interactive demo
Try out our interactive demo for a hands-on walk-through experience.
If the demo doesn't display properly, try expanding your browser window or opening the demo in a new tab.